Microsoft Power BI is a powerful business intelligence toolset that allows you to take control of your data and build visually appealing and interactive reports that can be accessed from anywhere. By harnessing the power of the cloud, users can take big data sets from various sources, express the data as a Power BI visual, and provide intelligent analytics insights.
What is Power BI
Microsoft Power BI is a powerful business intelligence toolset that allows you to take control of your data and build visually appealing and interactive reports that can be accessed from anywhere. By harnessing the power of the cloud, users can take big datasets from various sources, express the data as a Power BI visual, and provide intelligent analytics insights.
Why Power BI
Microsoft Power BI is an intuitive tool that can help propel your organization into a data driven culture. Power BI offers an enterprise grade data analytics environment that can be seamlessly customized to meet the needs of your organization. The Power BI service provides you with tools to keep your reports up to date by automatically refreshing and publishing your reports, delivering your users with the latest information.
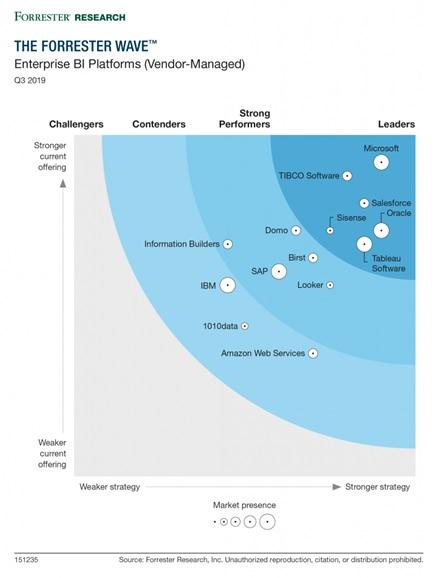
What makes Power BI such a great option for both data analytics and business intelligence, is how it allows users to do data preparation, data analysis, reporting, and dashboards within a single tool. Because of this, Microsoft has been recognized by Forrester Research as a leader in the BI enterprise platform front. According to Forrester Research, the Microsoft Power BI platform is not only a “killer” product, but it has the strongest current offering compared to its competitors.
Overview of Power BI
Microsoft Power BI offers a variety of options to access your data, with the three main options being the iOS and Android mobile apps, the online Power BI service, and the Power BI Desktop. Power BI Desktop is usually the preferred option for report and dashboard setup and design. The desktop app offers various options to import and transform your data, being comprised of three main sections: the report view, the data view and the model view.
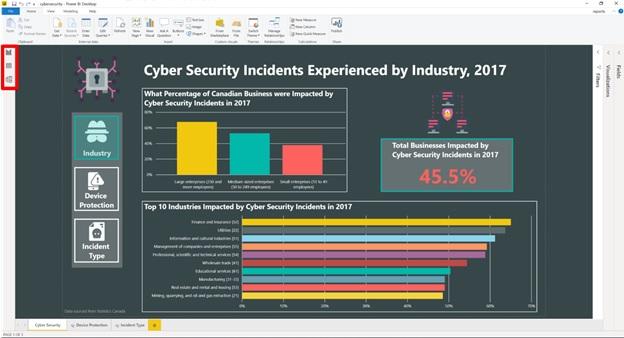
Report
The report feature in Power BI Desktop provides you with 32 pre-built data analytics visualization tools and a marketplace packed full of 3rd party visualization add-ons. Simply select the visualization of your choice in the visualizations pane and drag the data from the fields pane into your newly created visual. From here you can finalize the overall look and feel of your report and publish it to the Power BI Service to be accessed online by your organization.
Data View
The data section of Power BI Desktop provides the ability to view all your various dataset tables, providing you the ability to inspect snapshots of your data. With Data View you are viewing your data after it has been loaded into the model.
Model
The data modelling feature in Power BI Desktop allows you to create relationships between multiple tables of data by simply dragging a table field onto the associated field in the other table. Now instead of requiring a data engineer to build table relationships, a competent Power BI professional can build relationships easily.
Connectors
Since data can be stored in a variety of formats, adding different data sources may prove to be difficult. Power BI provides a large selection of popular data sources that connect directly to your reports. Some popular examples of databases that Power BI supports include MySQL, SQL Server, Access and PostgreSQL. View a full list of all supported data sources in Power BI.
REST API
Power BI offers a REST API that provides you with administration, embedding and user resources service endpoint calls. The API provides you with the ability to manage large datasets and reports easily. For example, if you have the same report used in multiple workspaces, making changes to the report can prove challenging. With the REST API, you can make changes to a single report and push it to all your workspaces with one click.
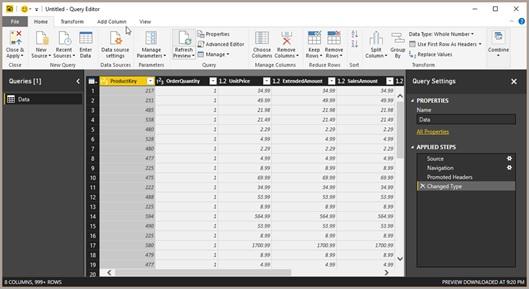
Power Query
Power Query is a tool in Power BI that allows you to shape and combine data, offering you over 300 different data transformations that can be previewed before being applied to the dataset and a variety of data connectors. Some example methods of shaping data in Power Query are renaming columns, converting text to a number, and creating custom calculated columns. In the Power Query Editor, you can easily see all the various actions that have been applied to the data under the Applied Steps field. These step-by-step actions provide a simple readable set of instructions when reviewing report queries.
Reference: https://powerbi.microsoft.com
Measures and DAX
For simple calculations such as summing, counting, or finding an average, Power BI provides the ability to create Measures that use Data Analysis Expressions (DAX) formula language. The DAX library provides over 200 functions, operators and constructs to calculate results for your data analysis requirements. Since DAX is used in Microsoft Excel, you can easily copy previously created formulas from your Excel spreadsheets and add them to your Power BI Measures.
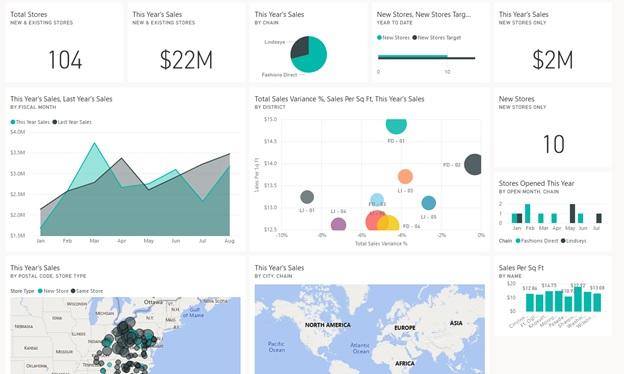
Dashboards
The Power BI dashboard is a simplified web canvas on Power BI online service that allows you to import visuals of your choosing from multiple reports and pin them as tiles to the dashboard. This means that instead of having to consolidate multiple datasets into one report, you can have multiple reports and showcase only pertinent visuals needed for the user.
Reference: https://powerbi.microsoft.com
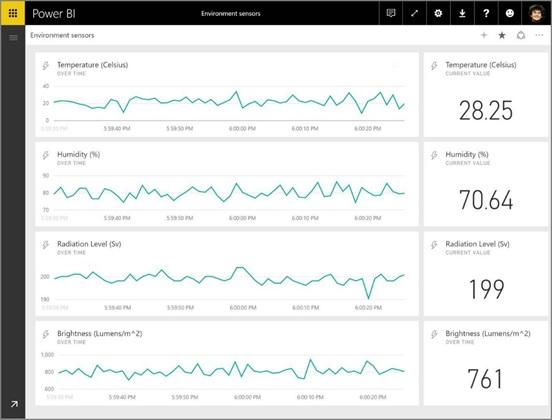
Stream Data in Real Time
With Microsoft Power BI, you can stream data from sensors, social media sources, service usage metrics, and any sources that can collect or transmit time-sensitive data. In addition to streaming your data live, you also can create alerts that can notify when a trigger is activated. The alerting offered with Microsoft Power BI can aid your organization in responding to issues immediately before serious issues arise.
Reference: https://powerbi.microsoft.com
So, What’s Next?
At Softlanding, we have the skills to help collect, organize and visualize the multitudes of data being generated by your organization. Whether your organization needs help building a data warehouse to store and manage your data or building Power BI dashboards and reports with intelligent analytics insight, Softlanding can help develop a business intelligence and data analytic solution specific to your needs.
Contact us today for more information on how we can turn your organization into a data analytics power house with Microsoft BI.
Written By:
Colby Timm
Colby is a Software Developer and Data Analyst who works with the Power Platform, building Power BI reports and dashboards, and more recently building healthcare related PowerApps. Colby also has experience developing in SharePoint and developing web applications in .Net. He has a Microsoft certification in Power Platform Fundamentals.
More By This Author